Too many companies measure and evaluate customer experience in aggregate, by segment. This method often neglects to take into consideration a customer’s unique experience and falls short of being an effective measurement system. Without knowing how to evaluate customer experience properly, companies are left feeling unsatisfied with their own customer-centric strategy.
In this post, we’ll explore a journey-based approach to measure customer satisfaction and various CX metrics you can use. We already touched on some metrics in a previous article about the importance of customer experience, but we’ll elaborate on more of them here.
Improving Customer Experience Measurement In 4 Steps

Deciding what customer experience metric to match with a touchpoint can sometimes be difficult. To deliver the right kind of impact and create more value, we recommend that you follow this four-step framework for measuring and evaluating customer experience:
Create a comprehensive customer journey map
Often overlooked, it is critical to have a detailed visual representation of the process a customer takes to achieve a goal with your website, product, or service. This customer journey map should identify customer motivations, needs, and pain points.
If you have all the touchpoints on the customer journey mapped, you can start figuring out the right analytics to properly assess your customer’s experience.
For an effective customer-centric strategy, having a comprehensive and transparent overview from the very beginning is recommended, as opposed to only looking at transactional touchpoints.
Determine what are your customer experience measurement priorities
Do not waste resources on approaches that return little to no value to your business or customers. Establish your customer experience measurement priorities ahead of time to avoid confusion and deviation from the plan.
For example, the most valuable journeys you may want to measure are those that can track the progression of customer and business goals.
By identifying what can drive or block journey success, you can ascertain the improvements needed for potential business impact. This makes it easier to define the right CX metrics and KPIs to measure customer experience.
Ensure the right point in the customer journey uses the right customer experience metric
There is a tendency amongst a lot of companies to use only one customer experience metric – typically NPS, CSAT, or CES – throughout the entire customer journey.
This single-metric approach is not effective. At each stage of the journey, the customer has different experiences and different needs, so how can you expect just one metric to properly assess each of these different stages?
Once you’ve understood different touchpoints with your customer journey map, you can identify more appropriate metrics to use for each touchpoint on end-to-end customer journeys. This is key to gathering actionable results in the long term.
For further optimisation, you can even try to discover micro journeys from within the important macro journeys.
Monitor customer experience metrics in real-time and over time
For company executives to get better insights into measurement efforts, CX teams need to share detailed reports on what customer experience metrics are working both at a journey level and at an overall level.
You can use analytics tools with built-in, custom dashboards to reveal real-time statistics and track these metrics over time. This in-depth reporting can also help you discover any high-impact micro-journeys.
6 Customer Experience Metrics Explained
If you’re just starting or have a customer experience measurement program already in place, it’s critical to understand the wide variety of ways to measure customer experience. Here are six key customer experience metrics that are popularly employed by CX experts.
Net Promoter Score (NPS)
Net Promoter Score (NPS) is one of the most widely used metrics because it’s easy to understand and simple to record.
NPS shows the percentage of your customers who would recommend you to others – i.e., friends, family, or colleagues – which helps measure word-of-mouth marketing.
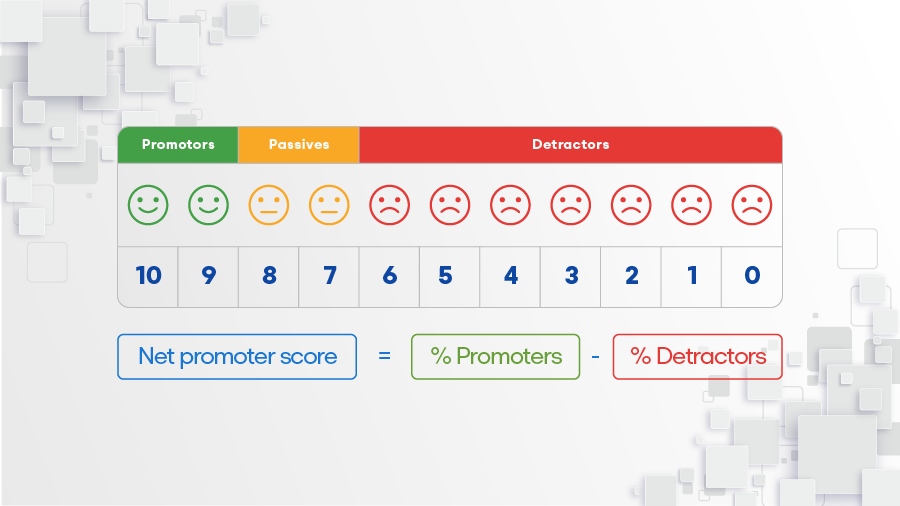
On a scale of 0-10, customers rate your company, product, or service. They rate according to a preceding or following question that reads: “How likely are you to recommend […] to a friend or colleague?” The respondents are grouped into 3 categories:

From your surveyed customers, NPS is calculated by having the percentage of detractors subtracted from the percentage of promoters. If observed every month, the increase or decrease in NPS can help companies predict future revenue gain or loss and plan strategies accordingly.
Customer Satisfaction (CSAT)
Customer Satisfaction (CSAT) is the mean or average score of customers who rate from 1 to 5 for their satisfaction after a given experience. Measured by an automated survey, CSAT is most often used in customer service or customer support interactions.

Since it’s based on users’ reactions to a product or service experience, CSAT is a useful metric to record for many things such as a product return, a customer care call, or a password change. A lot of businesses send out surveys to obtain a CSAT score within 30 minutes of a product or service being used.
Customer Effort Score (CES)
Customer Effort Score (CES) records the relative effort that customers put into figuring out a solution to a problem they’re facing with a product or service.
This problem could be a simple one such as looking for a product or a more difficult one such as resolving a technical issue.
Defined by a 5- or 7- point scale system, CES is usually measured by an automated survey. A typical CES question is to ask “How much effort did you have to put in to resolve this issue?” and the responses could vary from ‘Very difficult’ to ‘Very easy”. Follow both the mean or average score and the distribution of scores for the results.
CES is a good metric to measure because customers are looking for fast and convenient resolutions to problems and their survey responses can help determine whether your efforts to reduce these obstacles are effective or not.
Customer Churn Rate
Customer churn rate is a measure of how many customers stopped using your products or cancelled their subscription service in a given period of time. Keeping track of customer churn rate is critical for subscription-based business models because generally, it is much less expensive to retain existing customers than it is to acquire new ones.

Average Resolution Time
Average resolution time is the measure of the time it takes to completely resolve an issue from beginning to end. Also referred to as ‘Time to Resolution’, ‘Mean Time to Resolution’ and ‘Resolution Time’, this metric correlates well to CSAT and CES.

It’s quite simple to understand the results: the longer it takes to resolve customer complaints and issues, the more unsatisfied they are. This metric is useful in presenting how well your team is performing and how efficient your processes are.
First Contact Resolution (FCR)
First Contact Resolution (FCR) measures the number of customers whose question or request is resolved on the first attempt. This metric is usually recorded alongside Average Resolution Time for more thorough observation of CX efforts.

When you get the results, take note that a high FCR typically indicates high customer satisfaction. This also can translate into your customer service processes and teams working efficiently and producing desired results.
Creating the Right CX Measurement System is A Work in Progress

For companies to get the best value out of their customer-centric strategies, building an effective customer experience measurement program is essential to understand which parts of your customer experience are working and which parts need to be improved.
Applying the right CX metrics at the right stage of the journey to get the best results, however, takes some time and practice.
Talk to our experts today to find out how to optimize your customer experience and utilise a suitable journey-based approach for all your marketing needs.
We provide various services ranging from SMS marketing and email marketing to social media advertising as part of our digital marketing services.


